Friday, 24 December 2021

The Predicatable & Lazy End Of Year Roundup: 2021

Well, for the third year running, I have to reflect on what has been another challenging year, especially as Covid very much remains with us at year end and political leadership is in short supply.

However, I count my personal blessings and any problems I have fall into insignificance where so many people have it so tough. The one thing which has really crystalised in my mind is just how better streets can be a catalyst for a more resilient and egalitarian society, especially where local communities are concerned. This has come from both reading (including some frankly daunting academic study here and there) and being able to immerse myself in the places I have visited and indeed some of the work I have done.

 A few weeks ago, this blog turned 9 years old and assuming I carry on at a weekly pace, early summer will see me reach the 500 post mark which I am very much looking forward to reaching. 

So, let me wish you a Happy New Year for 2022 and I look forward to continuing my adventures in time and space in the strange universe of highways and transport!

January
I got the year off to a slow start with another look at the work of my civil engineering hero, Sir Joseph Bazalgette, and how I thought that motorisation was our modern disease. I then argued that cargocycles could tame the suburbs, which gave me the opportunity to post lots of lovely photos.


I continued the month with an in-depth look at how advertising boards could be managed, although I would prefer we got rid of them completely. the next post of the month didn't have me travelling very far to have a look at the works outside my front door when the footway was renewed.

The final post of January was the fantastic news that the first shipment of the UK version of the Dutch inritbanden (or entrance kerb) was about to leave Charcon's yard for deployment in a scheme - something I had been chewing over with the manufacturer for a few years.

February
Low Traffic Neighbourhoods and the use of ANPR cameras was the first post of the month. I had a dig through the subject and while I remain of the view that actual physical measures are much better than cameras, if they are used, then they need to come with layouts that actively dissuade non-compliance.

My part of London was hit by snow and I returned back to the subject of winter maintenance and the politics behind it with a look at the role of the development management engineer the week after.


I ended the month with one of my favourite subjects of the year which was the Dutch voorrangsplein junction (above) which is a concept that the UK has kind of tried in places, but never got it right. I think we could make great use of the concept.

March
I continued with a second post on the voorrangsplein concept before posing the idea that driving and parking should be banned everywhere with a case by case justification for something different - the opposite of what we have now.


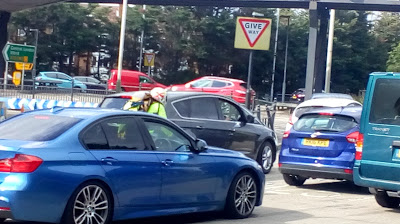
I then went behind the headlines of the "who is at fault" culture war so beloved by the UK media before taking my first trip of the year to have a look at the Barking Riverside development (above).

April
My occasional "kerb your enthusiasm" series return with a look at why dropped kerbs at pedestrian crossings need to be flush after a shoddy (and still unresolved) crossing installation by my local council.


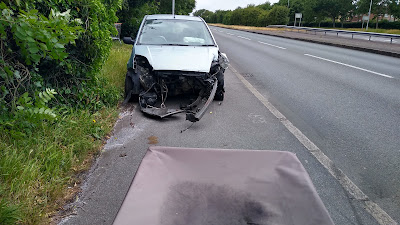
There was then a two-part post on a trip I made to Thamesmead in southeast London where I had worked in the late 1990s/ early 2000s. The first post looked at some older infrastructure in the area and the second looked at some very modern and in many ways poorer layouts which had been recently built. I then had a look at the anatomy of a road crash in Glasgow where an elderly man caused a collision, but the layout needed to take a fair bit of blame.

May
As the weather started to get warmer, I had the opportunity to stretch my legs and this time, I reported from Birmingham over two posts. First was a look at the A34 Blue Route to the north of the city, followed up by the A38 route which runs out to the southeast (below).


Next was a look at how we can design for lower speeds, which featured plenty of Dutch practice that we could employ in the UK. Following a talk I gave to Cyclox, I posted a detailed look at the five principles of good cycling design, before ending May with a look at what actually makes a Dutch roundabout after seeing North Tynside Council suggesting it was looking at a Dutch-style roundabout (it was very far from it).

June
I had been interested in "diagonal dividers" for ages and so I got out on my bike to find some historic examples around London and I wasn't disappointed. I then had a look at a wonderful scheme at Old Bethnal Green Road in London.

Next was another infrastructure visit to the new roundabout at Drayton Park in London where I had to slap my own wrist for calling it Dutch-ish. 


Talking of roundabouts, my last post for June was from the magnificent Dutch roundabout at Fendon Road, Cambridge (above) which, despite the drizzle, was one of my year's highlights.

July
As the summer got underway I got annoyed at how difficult it was to change the status quo with a suggestion that there needed to be a network management plan duty on local authorities to classify streets by intended use which would shape future works. I then had a look at one-way vs two-way cycle tracks and how I would prefer to see them deployed before a quick look at how speed and road design are related.


After a couple of work-related visits to hospitals, I thought about how we might better serve them with cycling.

August
The month started with a look at London's Cycleway 4 which I celebrated as boring because it was no longer unusual, it does an excellent job and doesn't stand out as a "thing" which is what all cycling infrastructure should do. I then had a look at rain gardens which both deal with surface water and can add some life to the street.


A visit to look at the Railton Low Traffic Neighbourhood in Brixton got me out and about again (above) and then I followed with a post which put cycle tracks into tight spaces. The month ended with a post about my family adventures in Dorset for which we had to hire a car with our old one going wrong. We had an interesting few days with a hybrid, although by interesting, I mean faff.

September
In the second post from my holidays, I took a look at a lovely filtering scheme in Poole's port area (below) and then a look around the streets of the seaside town of Seaton.


Back in London, I took a look at a curious road layout at the Olympic Park before swinging by the pop-up Cycleway 9 in Chiswick which is already being made permanent.

October
My first post from October looked at squeezing cycling into pinch points created by bridges where there isn't space for cycle tracks across them, but where we can get creative. I then had a look at one of the most hostile retail parks I have ever visited by cycle before looking at colourful crossings and if they had any point.


Next was a thought piece on the culture war around driving vs active travel and then the month was ended with a deep dive into floating bus stops and the research which has convinced me they are safe. This was my most popular post of the year which got 1,850 visits.

November
As the nights started to draw in, I looked at how we might assess walking environments with an emphasis on the very accessible Walking Route Assessment Tool. I then got out and about again to look at two very different zebra crossings in London.


Next was a look into contraflow cycling on one-way streets where I dusted down the early research to show another concept which has been with us for decades and yet gets controversial for some reason before ending the month with my rediscovery of sketching.

December
The PV² method of rationing pedestrian crossings annoyed be at the start of the month, but I followed it up with a post proposing a better way of prioritising which sites we should tackle. 

Finally, my last substantive post of the year was some thoughts on risk, a subject I often return to.

Saturday, 18 December 2021

Balancing The Risk

I've written about risk a fair bit in the past, but it's always worth coming back to this interesting subject every now and again.

The thing about risk is that we deal with it all the time without actively thinking about it, but when we stop, we are often poor at assessing it. For example, if we make and carry a hot drink from the kitchen to another room, we have unconsciously weighed up all sort of risks - the risk of electric shock from the kettle, spilling the drink over ourselves and tripping over because we are concentrating on the drink and not the floor.

A mug which says "east, sleep, cycle"

When you stop to think, you realise that although the consequence of electrocution is high, the likelihood is very low because of your faith in the systems in place to make sure kettles are sold safe and this extends to the fact that they all have short cables this days to reduce the potential of small children pulling the off the counter. In other words, the system has been engineered to protect the end user.

The walk from kitchen to the other room is something we have a great deal of experience of. Spilling a hot drink on oneself can lead to severe consequences for some people, although most people will probably not be injured. The actuality of spilling your drink will be low for most people too. At this point, I heartily recommend the "You're Wrong About" podcast which covers hot coffee. the point here, is that you have a highly developed skill of carrying mugs of hot liquid.

The walk between the rooms is something you have done so often that you are entirely familiar with it and you simply don't expect to come across any changes to the walking surface or an incident which will cause you to trip, even though you are invest more cognitive load in carrying your drink. Your ability to operate on autopilot is based in you not expecting any change in risk from something you have done for years.

So, we have some engineering with the kettle, skill and experience in carrying a hot drink and a local environment which is predictable - are these concepts starting to sound familiar? Of course, these are concepts we can transfer to streets thinking in terms of how we can create safe systems within which people can go about their business. Yes, there are features which require good engineering or regulation (the kettle), people should be able to prioritise their cognitive load where it's needed (carrying the cup) and the environment should be as consistent, legible and predictable as the walk between rooms.

We have developed an unhealthy obsession (or dependency) on the use of private cars in the UK to the point where their impacts are simply not seen or acknowledged by many people and beware anyone who raises the issue - you'll be called a crank or worse. It's a cultural problem that we have created and so when we want to challenge it through street design, it is no wonder that we get backlash. This car-culture isn't confined to people to drive a lot, it is also in the pores of people who don't drive and who have a learned experience of being subservient to motorisation. 

A car left on a shared use path with the front missing after a crash

The aftermath of a crash which is seen as routine,
but blocking the path of by a dual carriageway doesn't
feature as a risk in anyone's mind.

We shrug at casualties because they are seen as the price to pay for modern life. Air pollution and climate change don't push through because they are perhaps conceptual and lacking in immediacy. We can easily look at traffic conditions and decide whether to cross the road is an acceptable risk, but we can't look at buying a new car and working out how it will contribute to looking ahead to warming of the planet - it's a hazard which isn't going to cause us harm in the now.

People have a poor ability to assess risk and throwing that in with cultural norms from having a driving culture, all rationality goes out of the window. This is where we get people saying that a new pedestrian crossing is "an accident waiting to happen", that floating bus stops are dangerous to passengers or Low Traffic Neighbourhoods stop emergency vehicles getting anywhere - what people actually mean is we have disrupted what they are used to and so it feels riskier, even when objectively, we are reducing risks for many people.

Our poor ability to judge risk also means we put in acres of pedestrian guardrail, place warning signs everywhere and encourage the most vulnerable to wear yellow vests. In other words, we are wrongly assessing the risks and trying to use measures which don't tackle the main hazard and that's the use of motor vehicles.


Yes, the person in the yellow coat with the full face
crash helmet is on a pedal cycle mixing with motor traffic
about to enter a busy roundabout. Risk assessment all over the place!

Risk assessment as a process is interesting and it is valuable, but it is a skill and needs to be undertaken in a structured way. The key reason for doing it is to identify the things that have the potential and likelihood of causing the most harm and dealing with them, rather than the things that are less likely to cause harm and are unlikely to happen anyway. This is why in any safe traffic system, we concentrate on separating those moving with the most energy from those moving with the least and if we could get that right more often, then we can address to driving culture that takes so much effort to manage.

Saturday, 11 December 2021

Invitation To Cross

Last week, I looked at the PV² method of determining whether a pedestrian crossing is warranted and it's nice to say, the post got a fair bit of traction with many people commenting on how their local authority still uses it, even though it hasn't been in official guidance since 1995.

Some people have explained how their local authority has modified and weighted the process which essentially makes a crossing more warranted than under the original PV² thresholds, but it was still a numeric way of justifying and ranking interventions based on the number of people crossing now. It is tough for local authorities given the state of budgets, but the process is flawed for the reasons I set out last week.

The framework for assessment in LTN1/95 The Assessment of Pedestrian Crossings is still very useful in my view, but having to complete one for every request is resource-intensive and it doesn't lead to something which can be compared with another site, and besides it seems that local authorities want to be able to prioritise requests somehow. 

My own view is that prioritisation is a political role with staff providing appropriate evidence and guidance. In practice, that is easier said than done. In a past life, I took over The Requests List and the first thing I did was ask how it was dealt with. The answer was it just kept on growing and although sometimes a scheme came up which could accommodate a request, it was essentially a placebo to keep people quiet.

My approach (in the absence of any real budget for investigations) was to close the list and refer people to their ward councillors who would need to decide whether a request would be put forward to an advisory committee. If a request made it through committee, then it was added to the forward bid programme. OK, there was a little bit of professional advice that went to the committee, but the rationing was at least decided by elected people. 

From a staff resource point of view, not having to maintain a list and simply providing standard replies significantly cut down on workload, freeing staff to concentrate on funded schemes. This is probably of little comfort to those campaigning for improvements, but at least it did cut through the wild goose chase and got to the nub of the matter that decision-making is politically driven and that technical advice is just that. However, it was an unsatisfactory position to be in as it's always staff who have to deal with the complaints in the long term.

I digress, the key thing here is to ask ourselves from a technical point of view if there is a simple way of assessing and ranking requests for crossings, regardless of how the governance in decision making operates. The short answer is that any system we use which attributes any sort of ranking system will be flawed, but maybe the longer answer is there are some low cost things we could do which would still be fairer than PV².

My suggestion is that we use a framework based on driver behavior, "crossability" (traffic flow, crossing width etc) and local land use - in effect, let's actually take pedestrians who are crossing now right out of the discussion entirely and look at the environment that people have to negotiate. The rest of this post is really a work in progress and my thoughts. Maybe others can comment and adapt these ideas, but I'm after something which is relatively simple because of resource constraints and I'll take a little inspiration from LTN 1/95.

Physical Data
For a local authority, there will be some data available and some needs to be collected. In terms of physical information, there are some key metrics which we'll need. I should state at this point, anyone collecting on-street data should be undertaking a risk assessment, assessing risk dynamically on site and if alone, having a "buddy" system in place so that someone else knows where they are and how long they'll be with escalation if they don't check in.
  • Driver speed - unless location specific information is already available, then something is needed. Investing in a speed gun and taking some quick readings of say 100 vehicles off-peak would be fine for what is essentially a screening stage. A basic speed gun for a local authority isn't expensive and doesn't need to be of evidential (enforcement) quality. Faster speeds would mean more of a need for a crossing and off-peak, because that's when behaviour will generally be at its worst.
  • Traffic flow - a manual peak time traffic count is easy to do and there are plenty of apps available to record vehicle class because we'll ideally want to weight vehicle type using Passenger Car Units. Of course, it is also worth checking to see if there is data published by the Department for Transport. Higher flows mean it's harder to find a crossing gap.
  • Width of carriageway (including number of lanes in each direction) and footways - easily done with a measuring wheel. The width of carriageway is important as the wider it is, the harder it is to cross and the more lanes, the harder to cross. Footway width, because it's worth picking that up in case the scheme goes forward.
  • Length of unobstructed visibility from the general proposed crossing point - this will be used to check against driver speeds in terms of crossing selection or options because it's pointless if a crossing doesn't work in the location being checked.
  • At this stage, I am not looking at casualty data. While it might be a consideration for a scheme going forward, it doesn't necessarily give a good indication of risk exposure as it is simple an absolute at any given location.

Geographic Data
This is about looking at the amenities and any obvious attractors and mapping them. Things like schools, parks, care homes, shops, post boxes, medical facilities and so on are things that people will be walking to locally.

The task needs to be manageable and so I would probably think about what could be within a 5 minute walk around the site that a crossing could help with. 5 minutes is around 420 metres walked (at 1.4 metres per second, a pretty standard assessment of walking speed).

Maybe we could score the number of potential attractors within our selected radius with more being an indication of more need. Yes, this is rationing, but it is based on what people could get to if we built a crossing, rather than how many are crossing now.

Demographic Data
This is easily obtainable information which could be used to gain local insight into age (children and older people), long term illness and disability - probably the groups who most need help crossing the road. For example, children find it harder to judge speed and some people need more time to cross. Scoring here might be challenging, so maybe it could be assessed in comparison to the borough or district average, or maybe a national average. It's generally easy to find a local ward profile.

Processing Data
OK, we have collected a bit of data for the site at the lowest cost we can because we are just trying to screen requests to provide some advice to politicians. What do we report? We can slice this up any way we like and so what follows is just a suggestion;


The way I have set this up is where speed and flow is low, the carriageway is narrow, the number of lanes is low (one each way), attractors are limited and where the area generally has lower numbers of children, older people and disabled people/ those with longer term illness, the score is zero and from that, I think the logic for a score of 1 or 2 makes sense. The maximum score is 20 and so it does make conversion to a percentage really easy. You might need to review the demographic percentages for your local area.

Discussion
As I have said a number of times, this is rationing, but I have tried to couch an assessment in terms of risk exposure, the local demographic and places people might visit. The scoring and presentation echoes that of the Walking Route Audit Tool to give a bit of assessment consistency. Of course, one might then have a minimum score needed to take something forward, or perhaps a year's worth of scores can be used to rank the top five sites or whatever is possible and affordable.

I am not specifying the type of crossing needed because that is where more engineering thought is required, although for example, a 40mph dual carriageway is going to need signals or anything at 50mph+ really needs grade separation. In those cases, it's almost pointless doing an assessment because the answer is obvious.

I remain uncomfortable with rationing as an engineer because that is a political decision, but may be a simple assessment based on how easy it is for the local population to cross is a better way of looking at the issue, rather than the number of people crossing now which PV² skews against. That is for you or your local authority to decide.

Worked Example
Well, rather than have this as a theoretical idea, it's worth going through a couple of examples.

First, we have a location which is fairly busy in traffic terms, with a fair bit of speeding from drivers and a 30mph speed limit. The carriageway is quite wide and the local authority have stuffed two lanes in each direction into the space without a central reserve.


There are fewer children in the ward than the borough average, but more older and disabled people in the ward than the borough average. There are between 5 and 10 amenities in the area and so we get a score of 13.

In the second scenario, we have a much quieter residential estate with a 20mph speed limit, although we have a significant compliance problem which is a worry given that traffic flows are generally low.


There are lots more children in the area because of a primary and secondary school within the estate and in terms of attractors, there is a parade of shops nearby. There are also fewer older people and disabled people in the area versus the borough average. We get a score of 8.

So, this week, we are presenting crossing requests to the highways committee. There really is only budget to take one site forward for more detailed work. The first location has been requested by a local resident who has said they find it hard to cross the road to get to their nearest parade of shops. The second has come from the primary school and is supported by a 150 signature petition from parents. They demand a crossing to slow the drivers down. Which request would you take forward?

Personally, I'm going with the first. The street by the school does have a specific driver behaviour issue which needs addressing, but I don't think a crossing is the right answer in any case. The first site is difficult to cross for sure and there may well be latent local demand. The school would be very appealing with the petition and the emotion, but that's a political consideration. As a professional, my job is easy because I only have to advise, I don't make the decisions.

Saturday, 4 December 2021

Permission To Cross

Prompted by a question from Leo Murray, I have somewhat fallen down a little bit of a rabbit hole on the relationship between people asking for help to cross the street and how local authorities ration access to crossings.

Leo's (excellent) question was;

"How many pedestrians need to be crossing a main road at a location before a crossing is advised? I’ve been reading the Local Transport Note on pedestrian crossings but it does not give a number."

The question in itself suggests a run-in with a local authority policy which is so old, anyone working there probably doesn't know its origin and thus it has reached groupthink. It is so old, that it has never been recommended as a method throughout my entire postgraduate career (1995 onwards) and I had to go back to relearn it because I was so rusty!

The question alludes to a long defunct way of assessing whether a pedestrian crossing is warranted (bear with me), based on the relationship between traffic flow and pedestrian flow. This is known as the PV² rule and it was developed as a measure of the degree of conflict between people walking and driving to aid decisions on whether controlled crossings should be provided.

The technique requires continuous surveys to be undertaken with pedestrian and traffic flows. Pedestrian crossing flows are taken within 50 metres of either side of the proposed crossing site (which should try and pick an "average" crossing position if it is not clear) and both traffic and pedestrian flows in both directions added. The counts of pedestrians within 50 metres assumes that a crossing will see people within 50 metres migrating to it. 

Taking the pedestrian flow, P and multiplying it by the square of the vehicle flow, V, gives PV², which will be a large number and is expressed as 10(dividing the PV² value by 100,000,000 - 8 zeroes).


The PV² thresholds shown graphically

Where PV² is less that 1x10⁸, then a crossing isn't warranted, where PV² is between 1x10⁸ and 2x10⁸, then a controlled crossing should be considered. Where PV² is more than 2x10⁸, then we're looking at split controlled crossings. If we are considering a dual carriageway, then we would have to look at each carriageway separately, although that's going to make things even more complicated. 

The graph I have reproduced above comes from "Re-Examination of PV² Criteria for Developing Pedestrian Crossing Warrants", by Jain and Rastogi, 2016. It shows the type of crossings to be considered with the two thresholds, but with some nuances to pinpoint where zebra crossings might be appropriate which is essentially high levels of pedestrians and medium volumes of vehicles.

Interestingly, this graph is referenced in a few documents (mainly local authorities and reviews being done for them), giving a 1987 reference which I believe to be TA52/87 "Design Considerations for Pelican and Zebra Crossings". However, the graph actually combines two graphs in an older document, TA10/80, also titled "Design Considerations for Pelican and Zebra Crossings", below (apologies for the quality).


It's a bit tricky to understand all of this, so let's have some worked examples.


In the table above, I have shows hourly traffic and pedestrian flows for a 12-hour period. I have then found the four highest PV² values and taken their average in the penultimate line at the bottom of the table. Just below that, I have divided by 1x10⁸, (100,000,000) to give the assessment score. In this example, we have 0.05x10⁸ which means the site doesn't qualify for a crossing. You'll have to trust me, but the traffic flows (based on an urban area) are fairly modest and the pedestrian flows quite low. Let's run another example.


I have done the same again with different flows and this gives an assessment score of 1.41x10⁸ which means we should be considering a controlled crossing as we are between the two thresholds and from the graph, probably a pelican (pedex now). In this example, we've a busier road with distinct peaks which could be a fairly busy distributor road and maybe even an urban A-road. We've also quite a lot more people crossing. Let's look at another.


This time, we have an assessment score of over score of 2x10⁸ which means we should be looking at a split crossing, probably a pelican (pedex now). This is definitely an urban A-road, but it's far busier for more of the day than the previous example and we've more people crossing. One issue with the graph is that notwithstanding the score, you need at least 50 to 60 people crossing to hit the lines.

I want to show you two more tables. In the table below, I have taken the lowest traffic flows of the the three examples above and the highest pedestrian flow. The assessment score suggests no crossing is needed on the basis there is little crossing conflict with traffic.


The final table below does the opposite. Here we have the busiest road and lowest number of people crossing. Again, the assessment score suggests that no crossing is needed.


I wonder if you have worked out the pattern here yet? Let's work backwards. Given that very roughly speaking 2,000 vehicles per hour at peak is the upper threshold of an urban A-road (maybe a touch higher or lower, depending on the site), then we can reverse the PV² calculation to see how many pedestrians we need crossing to hit that 1x10⁸ lower threshold. So, 100,000,000 divided by 2,000, divided by 2,000 again gives us 25 pedestrians crossing to hit the threshold, although 25 pedestrians doesn't really hit the curve on the graph either.


People crossing a dual carriageway on the desire line.
The lower PV² threshold won't be reached here.

If we are surveying a site with very high traffic flows, but few people crossing, does this take into account that the very reason so few people are crossing is because there is so much traffic? It has taken me a while to work through to this point, but this is one of the fundamental flaws with PV² because it immediately ignores suppressed demand and it requires a sweet spot of traffic flow and pedestrians. 

If you go back to the tables, lower flows of pedestrians or traffic skew the result. In other words, a quieter road means people don't need help crossing or a busy road can mean stopping drivers to let a few people an hour cross isn't warranted. It's a system of rationing the opportunity to cross based on current conditions and the numbers of people currently willing to cross. TA10/80 suggests that PV² is fine for most situations, but sometimes there are special cases;
  • Where a road divides a substantial community.
  • Adjacent to community centres and homes for the elderly, infirm or blind [this is the language as used in the document].
  • Adjacent to hospitals or clinics.
  • Busy shopping areas.
  • Outside school entrances.
  • Where the number of heavy vehicles exceeds 300 per hour during the 4 busy hours.
TA52/87 also adds bus lanes, intermittent pedestrian flows (e.g. railway stations) and "other local considerations".

Let's go back to the history lesson. At the start, I mentioned 1995. As well as it being the year I graduated, it was the year that two Local Transport Notes were published - LTN1/95 The Assessment of Pedestrian Crossings and LTN2/95 The Design of Pedestrian Crossings. The former superseded TA52/87 and the whole concept of PV² was withdrawn from official advice. LTN1/95 uses a much more detailed framework approach based on the local conditions (the special cases in the earlier documents) and the users who are crossing and who might wish to cross and so is therefore a subjective, but structured approach. Plus of course, traffic volumes (and driver speed) and pedestrian flows are useful pieces of data which can help inform a design strategy.

LTN1/95 continued to be the official guidance until 2019 when it was incorporated (along with LTN 2/95) into Chapter 6 of the Traffic Signs Manual. LTN 1/95 and 2/95 were then withdrawn. Unfortunately, Chapter 6 doesn't include the full detail of LTN1/95, including a proposed crossing assessment record sheet, although nothing stops practitioners using it or something similar.

So, since at least 1980 we have moved from a pseudoscientific method of assessment through to a structured assessment process to a perhaps simplified assessment process. Why does PV² matter then? Well, go and search the term "PV2 crossing" with your favourite search engine and wonder at just how many local authorities are still using it to assess requests for new crossings - it's startling.

Some local authorities use a modified version where they might add a weighting because of local conditions or lower the threshold. In many cases, the local authority talk about LTN1/95 (even in very recent policy documents) and then continue to use PV² as if a couple of decades of it being withdrawn don't matter. Some won't look at anything unless it meets the PV² criteria, despite the early guidance actually setting out special cases.

PV² isn't just old fashioned, it is discriminatory. If the site being assessed doesn't have dropped kerbs, then it's going to be hard to count people using mobility scooters or wheelchairs who cannot cross there now. It ignores older people who need more time to cross and who cannot judge vehicle speed very well, it also ignores visually-impaired people who tend to prefer controlled crossings, people travelling with children who will move more slowly, older children (who still cannot judge vehicle speed) and all those who aren't crossing because it's intimidating. Like much in traffic engineering, we end up counting those who turn up and they are either the fit and the brave or those who really don't have much of a choice and brave it anyway.

Using PV² in today is very much a system of rationing and even where used with weighting and structured assessments, it is a way for local authority staff to weed out requests and indeed to put people off from requesting crossings in the first place. I am not really blaming the staff because resources are tight and things have to be prioritised. Of course, there might be an officer who doesn't want to hold up drivers for which PV² is a handy tool and there are still dinosaurs out there. In the main it's a system of triage designed to protect councillors who make resource decisions, rather than actually admitting that people need help to cross the road at a particular site.

Pushchair crossing a dropped kerb with tactile paving.

If you help one group to cross the road, you
make it easier for everyone to cross.

One thing we should also consider. Pedestrian crossings are (like many features of the street) driver infrastructure and so if we remove (or significantly reduce) the source of danger for people on foot (i.e. traffic), then we don't need formal crossings and limited resources can be targeted at main roads where people very much do need help crossing. This is another piece of traffic engineering lore which has its roots in the 1980s and yet persists into the 2020s.

One thing I haven't found yet and that is where PV² actually came from in the first place. Jain and Rastogi's paper suggest the thresholds "were formulated using empirical data based on peak flows of 1980s", but that assertion is not referenced and in any case, neither TA10/80 or TA52/87 give any hints. TA10/80 replaces in part Departmental Circular Roads 19/74 which might have shed some light (but I have not tracked this down as yet), although it does pop up in Hansard.

My bet would be that this goes back to a time where UK traffic engineering started to import ideas from the USA. In the web based Manual on Uniform Traffic Control Devices (MUTCD), the "pedestrian four-hour volume" is used to justify a signalised crossing. Here, less than 107 pedestrians per hour doesn't warrant a crossing. It's not PV² of course, but it does rather seem to ignore the fact that people might not be willing or able to cross now.

This post has been fascinating to to research, although in truth, I may have been able to dig deeper if I had time to do more than internet research (but hey, I have a day job). If you think I have got something wrong (yes, maybe my maths) or if you have any other insight, I'd love to hear from you. I should thank Simon Hartshorne of National Highways for providing me with copies of TA10/10, TA52/87 and some other background documents which have helped me piece together 40 years of history.